Cost of NOT Living Infograph.JPG
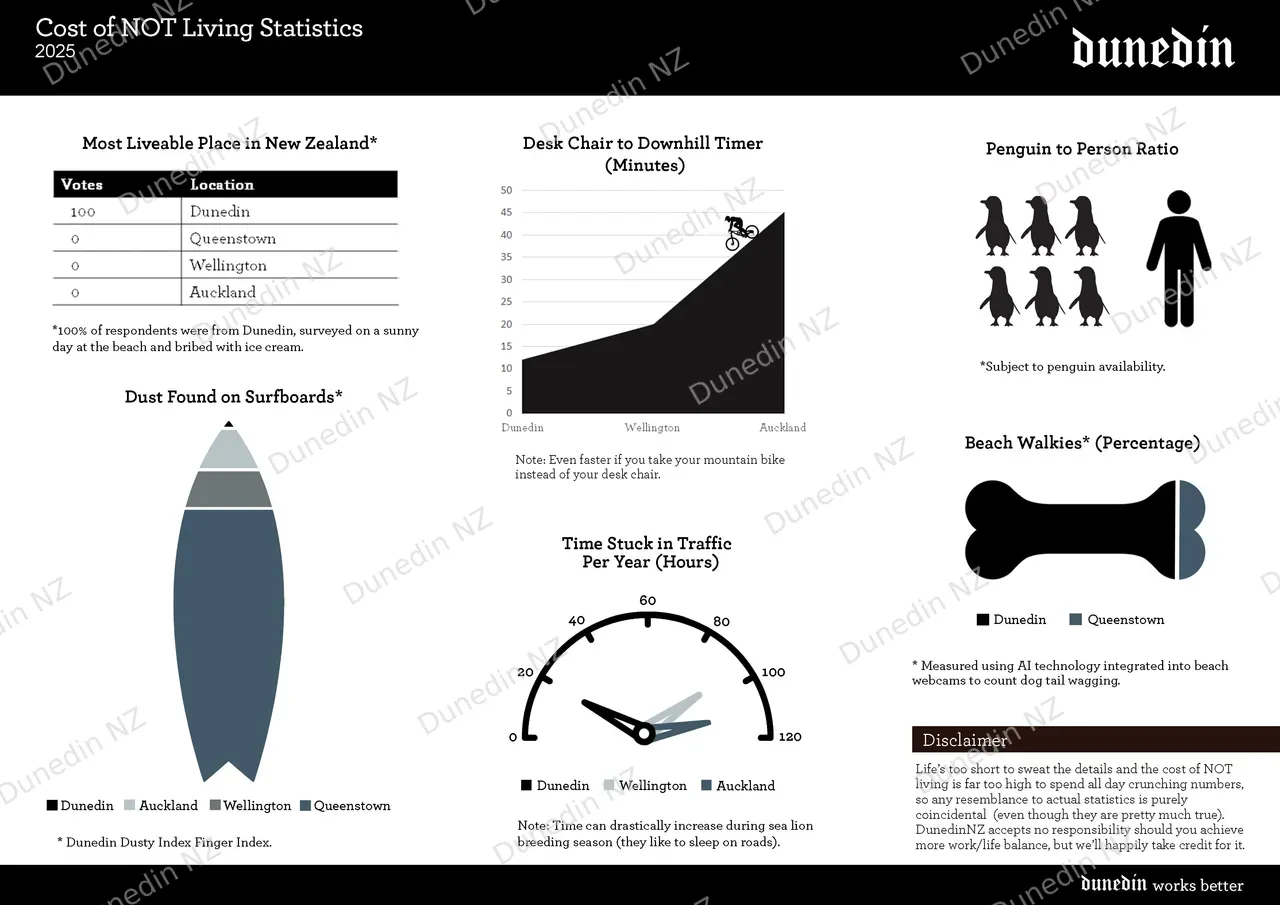
This infographic presents "Cost of NOT Living Statistics 2025" for Dunedin, highlighting its ranking as the most liveable place in New Zealand. It features data on desk chair-to-downhill timer, penguin-to-person ratio, beach walkers percentage, and traffic time comparisons among key cities.